👀 Demo data
The upper graphs and main metrics use the demo data source. The After meals and Confirmed meals sections below also use actual meal records from that demo source.
Daily TIR
Percentage of time in the 3.9–10.0 mmol/L target range for each day.
Daily CV
Daily glucose variability. A value below 36% is generally desirable.
days: 14
avg CV: 37%
Δ: -13%
Daily SD
SD is the spread of glucose values within a day. Lower SD means a more stable day. The graph background indicates approximate zones: good — up to 2.0 mmol/L, moderate — 2.0–3.0 mmol/L, high — above 3.0 mmol/L. Aim for a lower SD without increasing hypoglycemia.
days: 14
avg SD: 2.7
Δ: -0.3 mmol/L
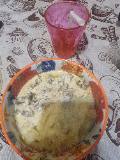
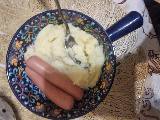
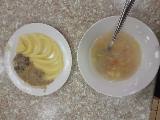
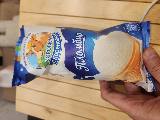
📸 Confirmed meals
Shows the latest 24 confirmed photo meals in the selected period and evaluates the outcome using CGM data over approximately the next 2 hours.
Cards
24
latest
Good outcome
3
good
Early rise
8
early peak
Late rise
1
at 2 h
Hypo risk
12
min < 3.9
Not assessed
0
insufficient CGM

2026-10-18 17:14
Peak was high
peak 13.8
Carbs
39 g
Recommendation
3.0 U
Start
4.4
2 h peak
13.8
At 2 h
10.9
Prebolus
13 min
Dose completed in parts
2.7 U
total injections matched the recommendation
Δpeak: +9.4 mmol/L · +60: 11.4 · minimum: 4.3

2026-10-18 12:34
Peak was high
peak 14.3
Carbs
32 g
Recommendation
0.0 U
Start
3.9
2 h peak
14.3
At 2 h
5.8
Prebolus
0 min
Insulin not found
0 U
until the next carb entry, maximum 180 min
Δpeak: +10.4 mmol/L · +60: 14.3 · minimum: 3.9
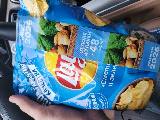
2026-10-17 15:35
Hypo risk detected
minimum 3.8
Carbs
73 g
Recommendation
3.0 U
Start
11.8
2 h peak
11.8
At 2 h
9.6
Prebolus
14 min
Dose was lower than recommended
0.1 U
recommended 3.0 U, less was given
Δpeak: 0.0 mmol/L · +60: 7.6 · minimum: 3.8
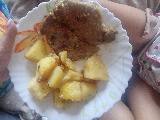
2026-10-17 13:51
Hypo risk detected
minimum 3.3
Carbs
45 g
Recommendation
0.0 U
Start
3.5
2 h peak
12.9
At 2 h
5.9
Prebolus
0 min
Insulin not found
0 U
until the next carb entry, maximum 180 min
Δpeak: +9.4 mmol/L · +60: 9.6 · minimum: 3.3
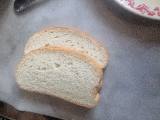
2026-10-17 10:16
Peak was high
peak 15.3
Carbs
30 g
Recommendation
2.0 U
Start
5.8
2 h peak
15.3
At 2 h
10.5
Prebolus
15 min
Dose completed in parts
2.3 U
total injections matched the recommendation
Δpeak: +9.5 mmol/L · +60: 13.3 · minimum: 5.8
2026-10-16 18:52
Peak was high
peak 12.3
Carbs
24 g
Recommendation
2.1 U
Start
8.7
2 h peak
12.3
At 2 h
12.3
Prebolus
11 min
Dose completed in parts
1.9 U
total injections matched the recommendation
Δpeak: +3.6 mmol/L · +60: 11.5 · minimum: 9.1

2026-10-16 16:44
Peak was high
peak 12.7
Carbs
96 g
Recommendation
3.0 U
Start
10.2
2 h peak
12.7
At 2 h
8.0
Prebolus
35 min
Dose was lower than recommended
2.3 U
recommended 3.0 U, less was given
Δpeak: +2.5 mmol/L · +60: 9.8 · minimum: 7.4
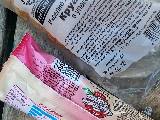
2026-10-16 13:50
Peak was high
peak 12.8
Carbs
19 g
Recommendation
1.9 U
Start
10.0
2 h peak
12.8
At 2 h
6.0
Prebolus
35 min
Dose completed in parts
2.1 U
total injections matched the recommendation
Δpeak: +2.8 mmol/L · +60: 7.4 · minimum: 5.6







Period
14 days
Period: 2026-10-05 → 2026-10-19
TIR
73%
3.9–10.0 mmol/L
Average glucose
7.3
mmol/L
GMI
6.4%
estimated HbA1c
Below 3.9
11%
for the period
Above 10.0
16%
for the period
CV
40%
variability
Carb entries
280
events with carbs > 0
Total carbs
5123
grams
Boluses
338
events with insulin > 0
Total insulin
116.3
U
Food photos
56
photo analyses
CGM points
18071
cached for the period
Meals and calculation
This section is based on meal_events for the selected period. These are actual meal-calculation events, including meals where no photo was used.
Typical meal: about 49.5 g carbs per meal.
Prebolus used: 73% of meals.
Worth checking: meals with 50+ g carbs — 21 (43%).
Meal calculations
49
meal_events
Average carbs
49.5
g per meal
Average dose
2.6
U
With prebolus
36
meals
Average prebolus
16.3
min
Meals with 50+ g carbs
21
meals
Before meal
Average glucose
6.8
mmol/L before meals
Above target before meal
30
meals
Falling before meal
11
falling glucose
No recommended dose
1
meals
The demo below shows photo-based meal examples, meal history and visual outcome summaries.
After meal
Evaluation based on meal_events and CGM data cached by Dia.best. Shows what happened approximately 60 and 120 minutes after the meal.
Stable outcome: 16 scenarios without a notable peak.
Peak above 10.0: 27 scenarios at approximately 2 hours.
Late rise: 8 scenarios where glucose at 120 min rose noticeably more than at 60 min.
Has +60 point
49
meal scenarios
Rise at 60 min
+0.9
mmol/L
Has +120 point
49
meal scenarios
Rise at 120 min
+0.8
mmol/L
By meal size
Comparison of outcomes for meals with under 30 g, 30–50 g and 50+ g of carbohydrates.
under 30 g
16 meals
stable 50% · peak 44% · late rise 6%
30–50 g
12 meals
stable 25% · peak 58% · late rise 8%
50+ g
21 meals
stable 24% · peak 62% · late rise 29%
Days in period
The bar shows daily TIR. Average glucose is shown on the right.
2026-10-19
26%
11.3 mmol/L
no hypo
2026-10-18
83%
7.5 mmol/L
mild hypo
2026-10-17
67%
7.3 mmol/L
significant hypo
2026-10-16
67%
8.3 mmol/L
mild hypo
2026-10-15
66%
7.1 mmol/L
significant hypo
2026-10-14
85%
6.7 mmol/L
significant hypo
2026-10-13
78%
6.1 mmol/L
significant hypo
2026-10-12
67%
7.4 mmol/L
significant hypo
2026-10-11
80%
7.2 mmol/L
significant hypo
2026-10-10
72%
7.4 mmol/L
significant hypo
2026-10-09
63%
7.7 mmol/L
significant hypo
2026-10-08
70%
7.0 mmol/L
significant hypo
2026-10-07
68%
7.5 mmol/L
significant hypo
2026-10-06
84%
7.3 mmol/L
mild hypo
Time of day
For each hour: average glucose and whether readings are most often in range, above or below. The block is compact for mobile.
Best hours: 00:00–05:00, 07:00, 10:00–13:00, 14:00–16:00, 19:00, 21:00
Difficult hours: 18:00
Worth checking: 05:00–07:00, 08:00–10:00, 13:00, 16:00–18:00, 20:00, 22:00–24:00
00:00
in range
7.6
TIR 78%
01:00
in range
7.8
TIR 72%
02:00
in range
8.6
TIR 72%
03:00
in range
7.8
TIR 90%
04:00
in range
7.5
TIR 92%
05:00
below
6.6
TIR 87%
06:00
below
6.3
TIR 88%
07:00
in range
6.5
TIR 95%
08:00
below
6.8
TIR 97%
09:00
below
6.5
TIR 92%
10:00
in range
8.4
TIR 76%
11:00
in range
7.5
TIR 77%
12:00
in range
6.4
TIR 78%
13:00
below
7.5
TIR 62%
14:00
in range
7.9
TIR 71%
15:00
in range
7.2
TIR 62%
16:00
below
6.2
TIR 62%
17:00
below
6.8
TIR 63%
18:00
above
9.4
TIR 49%
19:00
in range
8.1
TIR 65%
20:00
below
7.1
TIR 75%
21:00
in range
7.1
TIR 66%
22:00
below
6.5
TIR 67%
23:00
below
6.1
TIR 76%